When creating tutorials at HashiCorp Learn, one of the advanced challenges we like to suggest is to “build this project again, but from scratch.” We first like to help people learn quickly by giving them the code and environment to succeed in only a few minutes. But after you understand the basics, you can prove more proficiency with the concepts if you can start over build it by yourself from scratch.
I recently did that when using the R statistics environment to learn about building a data model to predict the future or describe the present. I built a model to predict season-long win totals for NFL teams. Then I added two other prediction models for comparison. I charted all three (plus actual wins).
NOTE: This article is more of a show and tell instead of a step by step tutorial. See the code for the implementation.

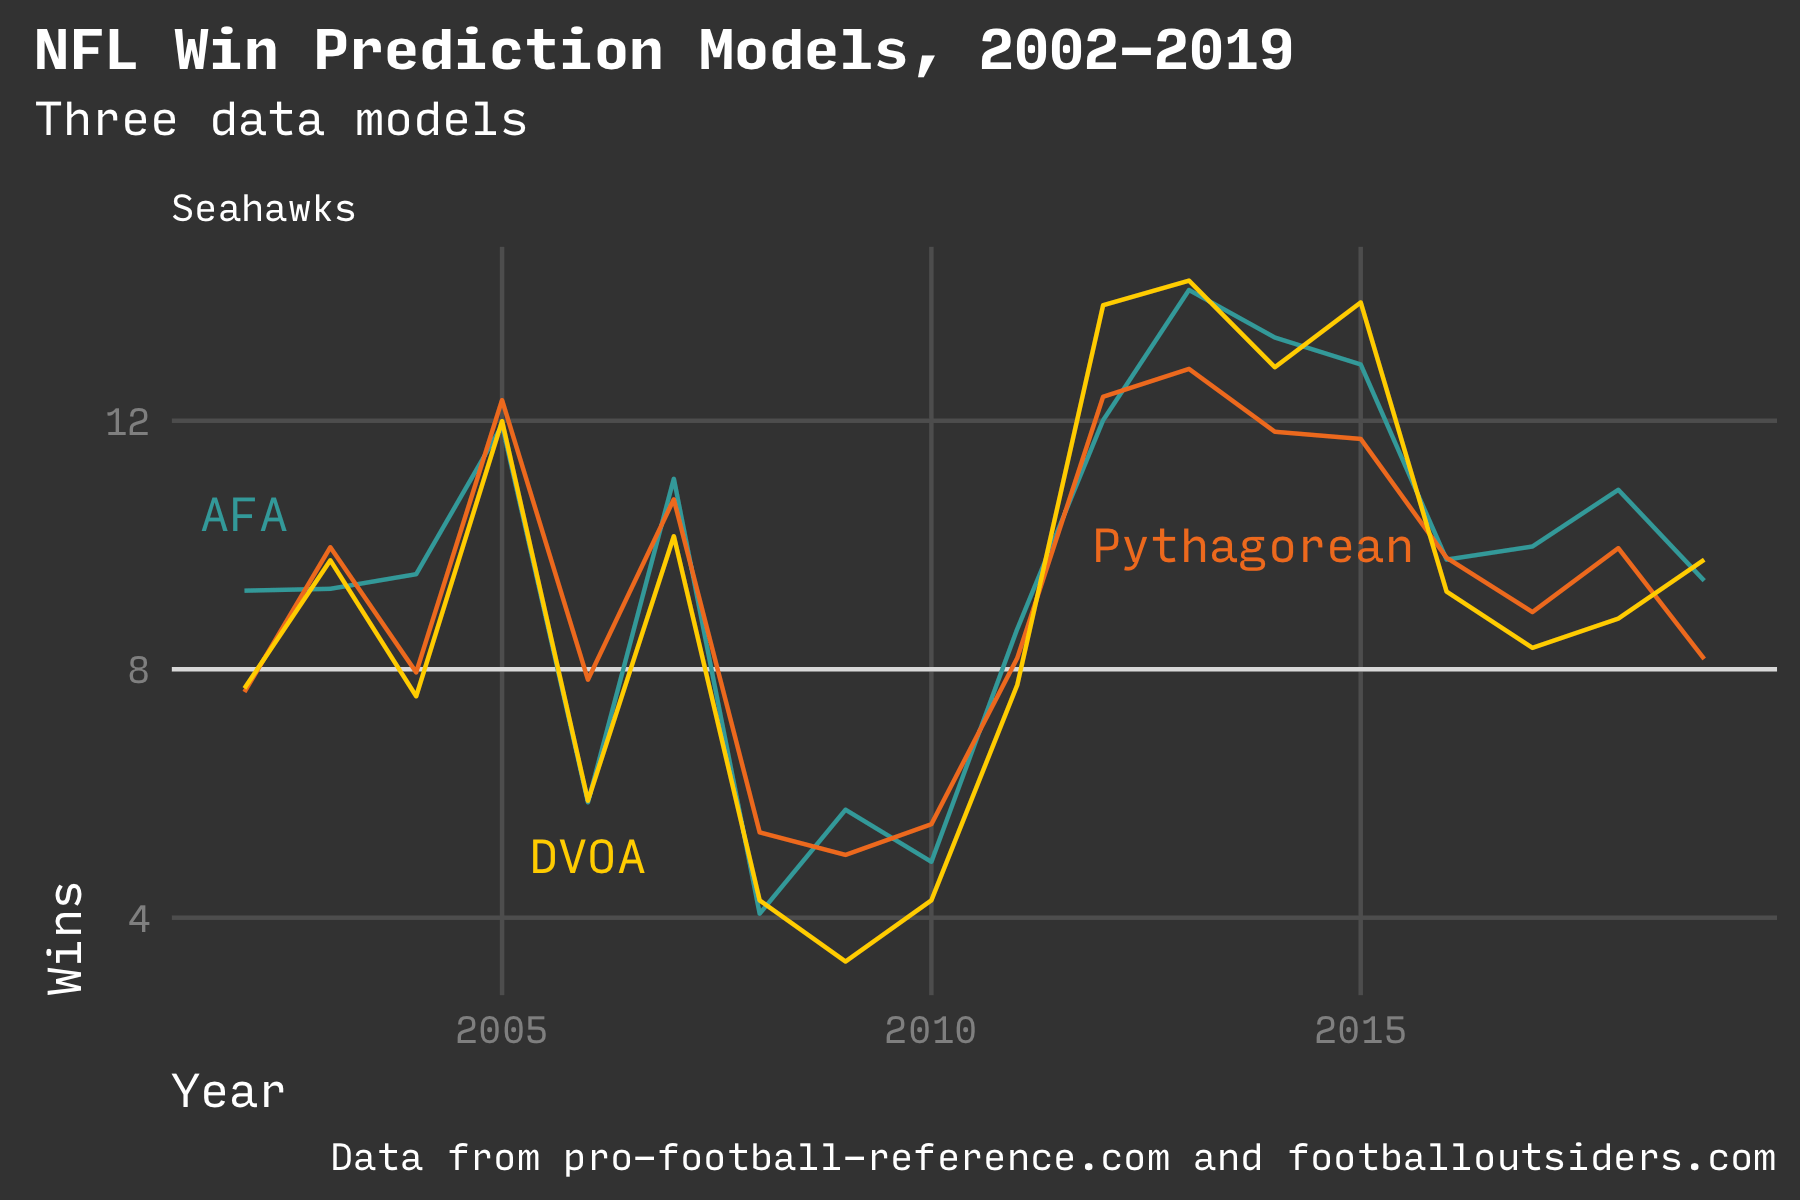
Three win prediction models: Adv Football Analytics, PFF DVOA, Pythagorean Wins
Model
The inspiration was a four part series from 2007 on the Advanced Football Analytics blog that describes the author’s personal model for understanding why teams win (Part 1, Part 2, Part 3, Part 4). The primary motivation of the project was not only to predict wins but also understand how each component of on-field performance contributes to a win. It purposely avoids using points scored anywhere in the model. Instead, it uses average yards per pass play, average penalty yards per play, and other efficiency metrics.
I know for a fact that I’m missing some of the data points used by the author (such as forced fumbles), but my results were pretty close to those described on the blog. I also also extended my model to cover the years from 2002 all the way to 2020.
The code I wrote is available on GitHub. In addition to the AFA model, I added models from Football Outsiders’ DVOA metric (a proprietary metric that looks at play-by-play events) and Bill James’ classic Pythagorean wins (a formula based only on points scored). All three predictions ended up being within a few wins of each other for any team and any year.
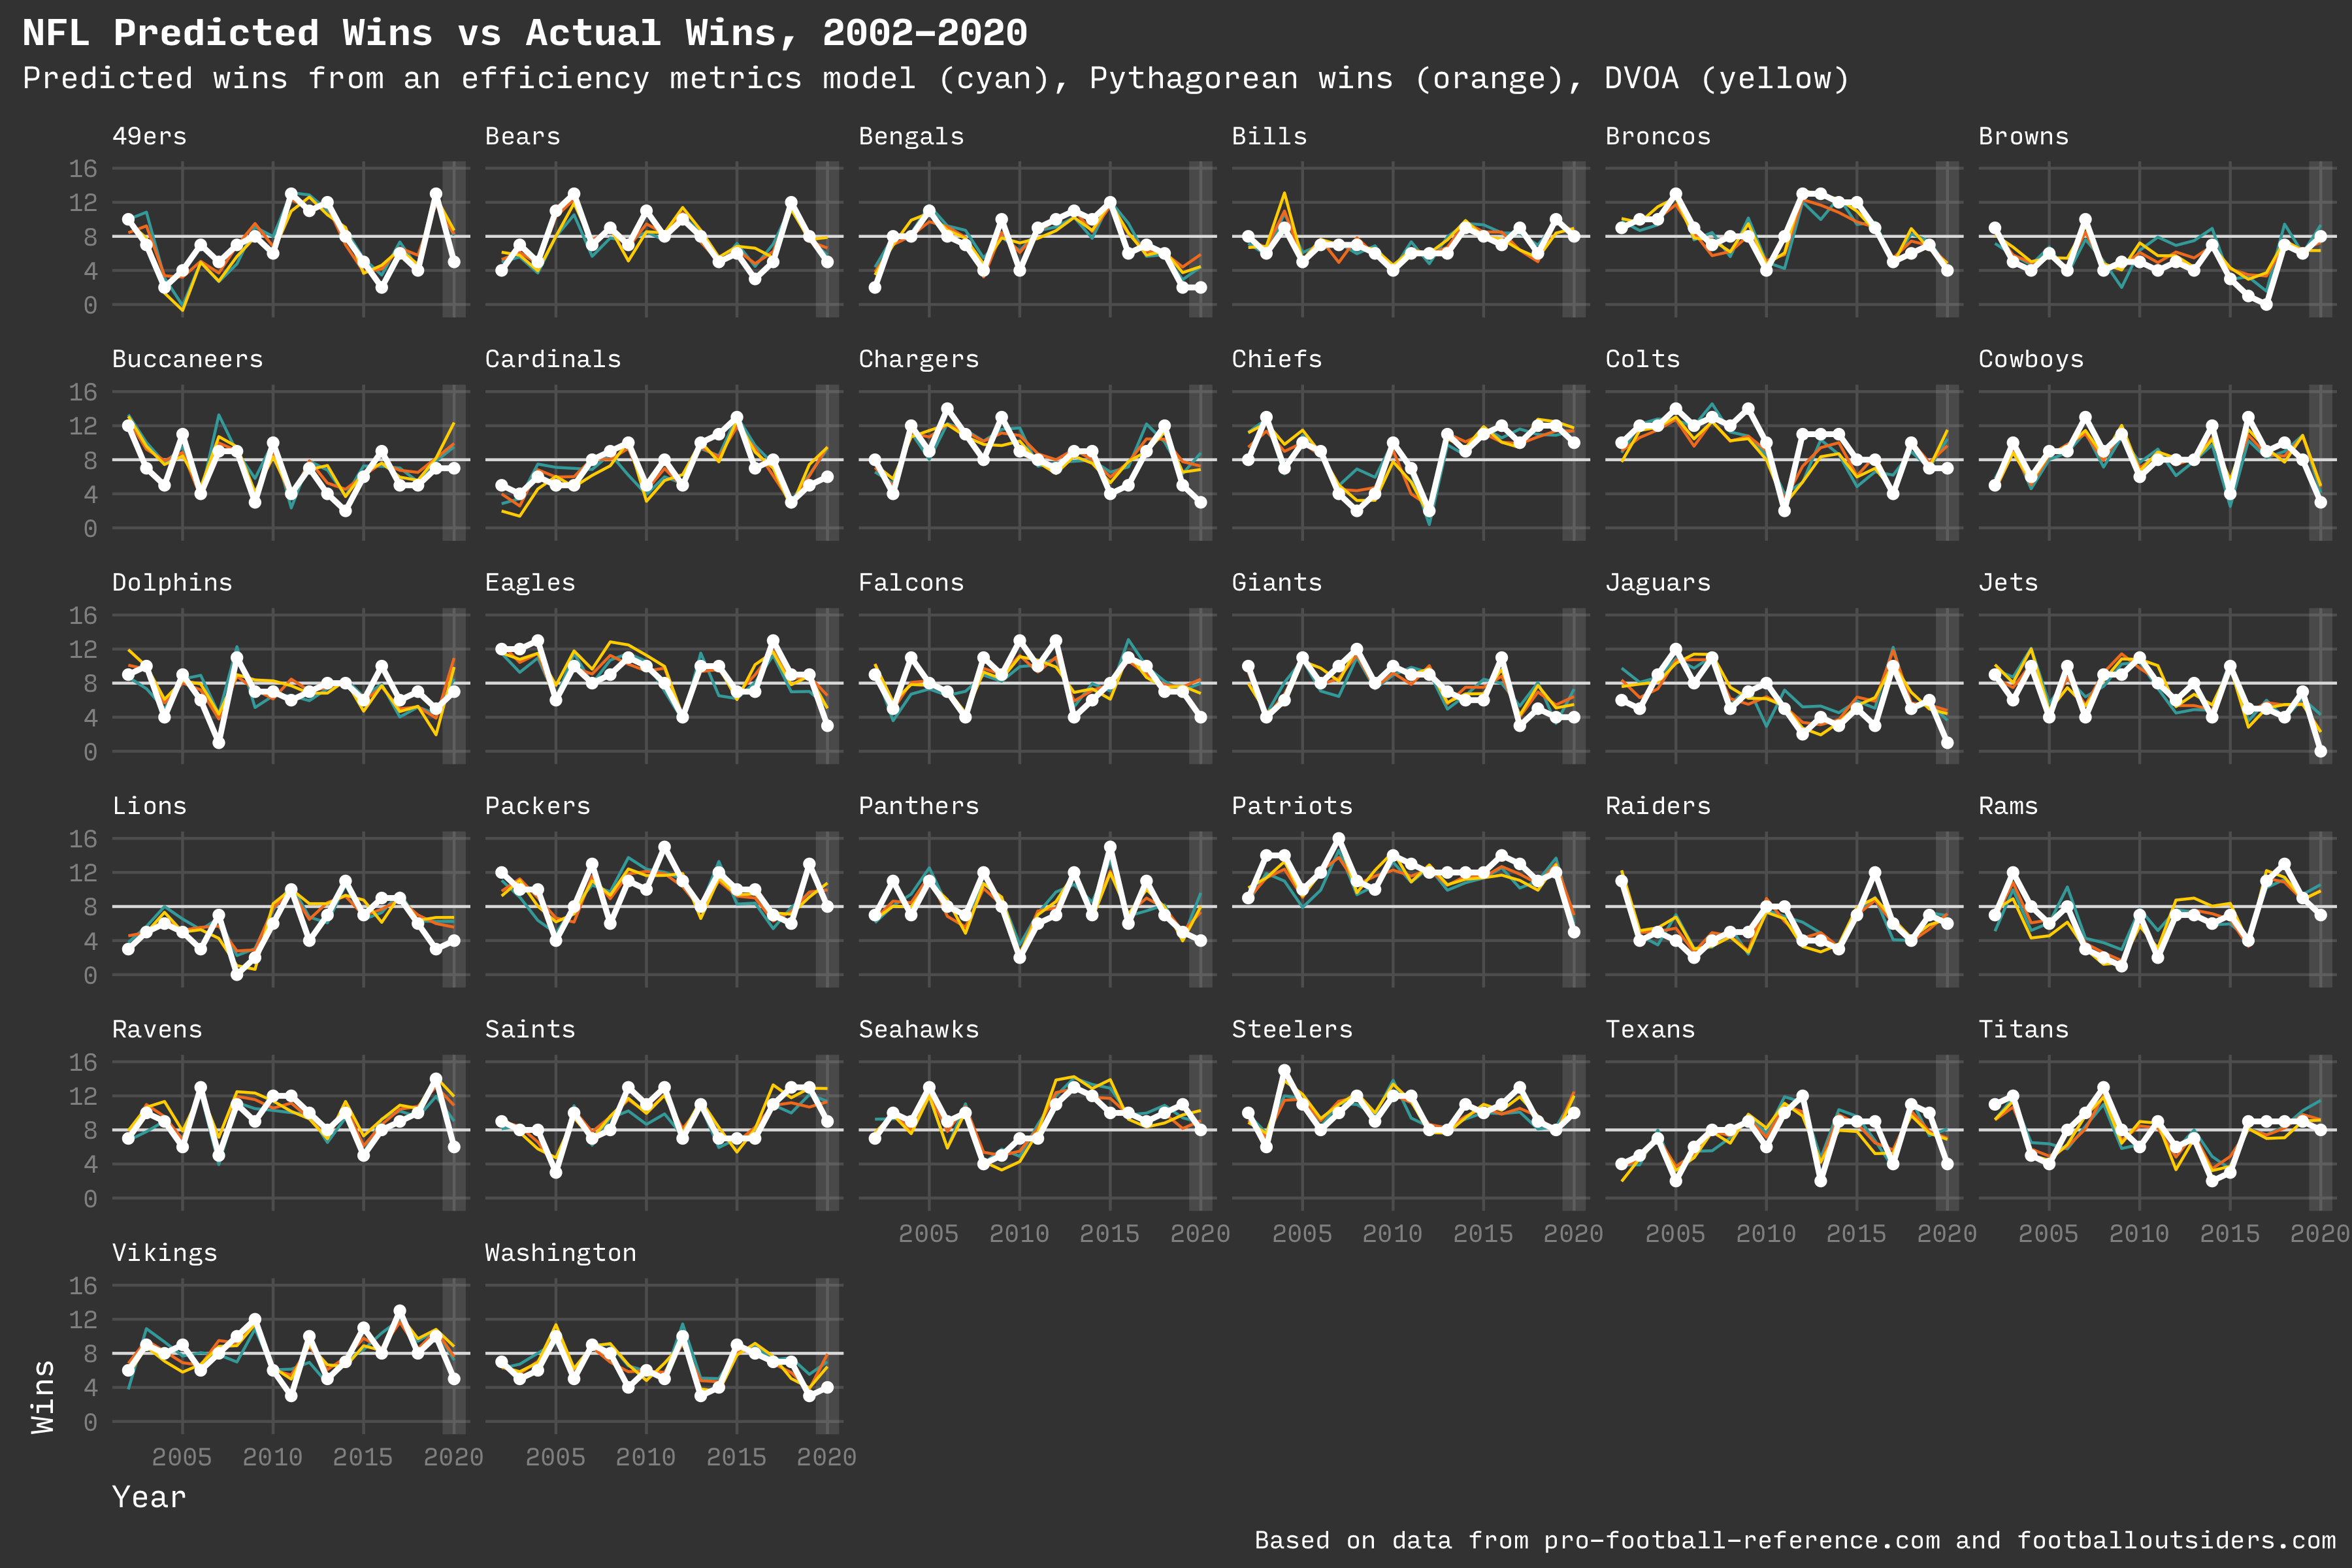
I created a chart for each team for the years from 2002 to 2020 (the season currently in progress). The final chart also shows the team’s actual wins for each year (in white).

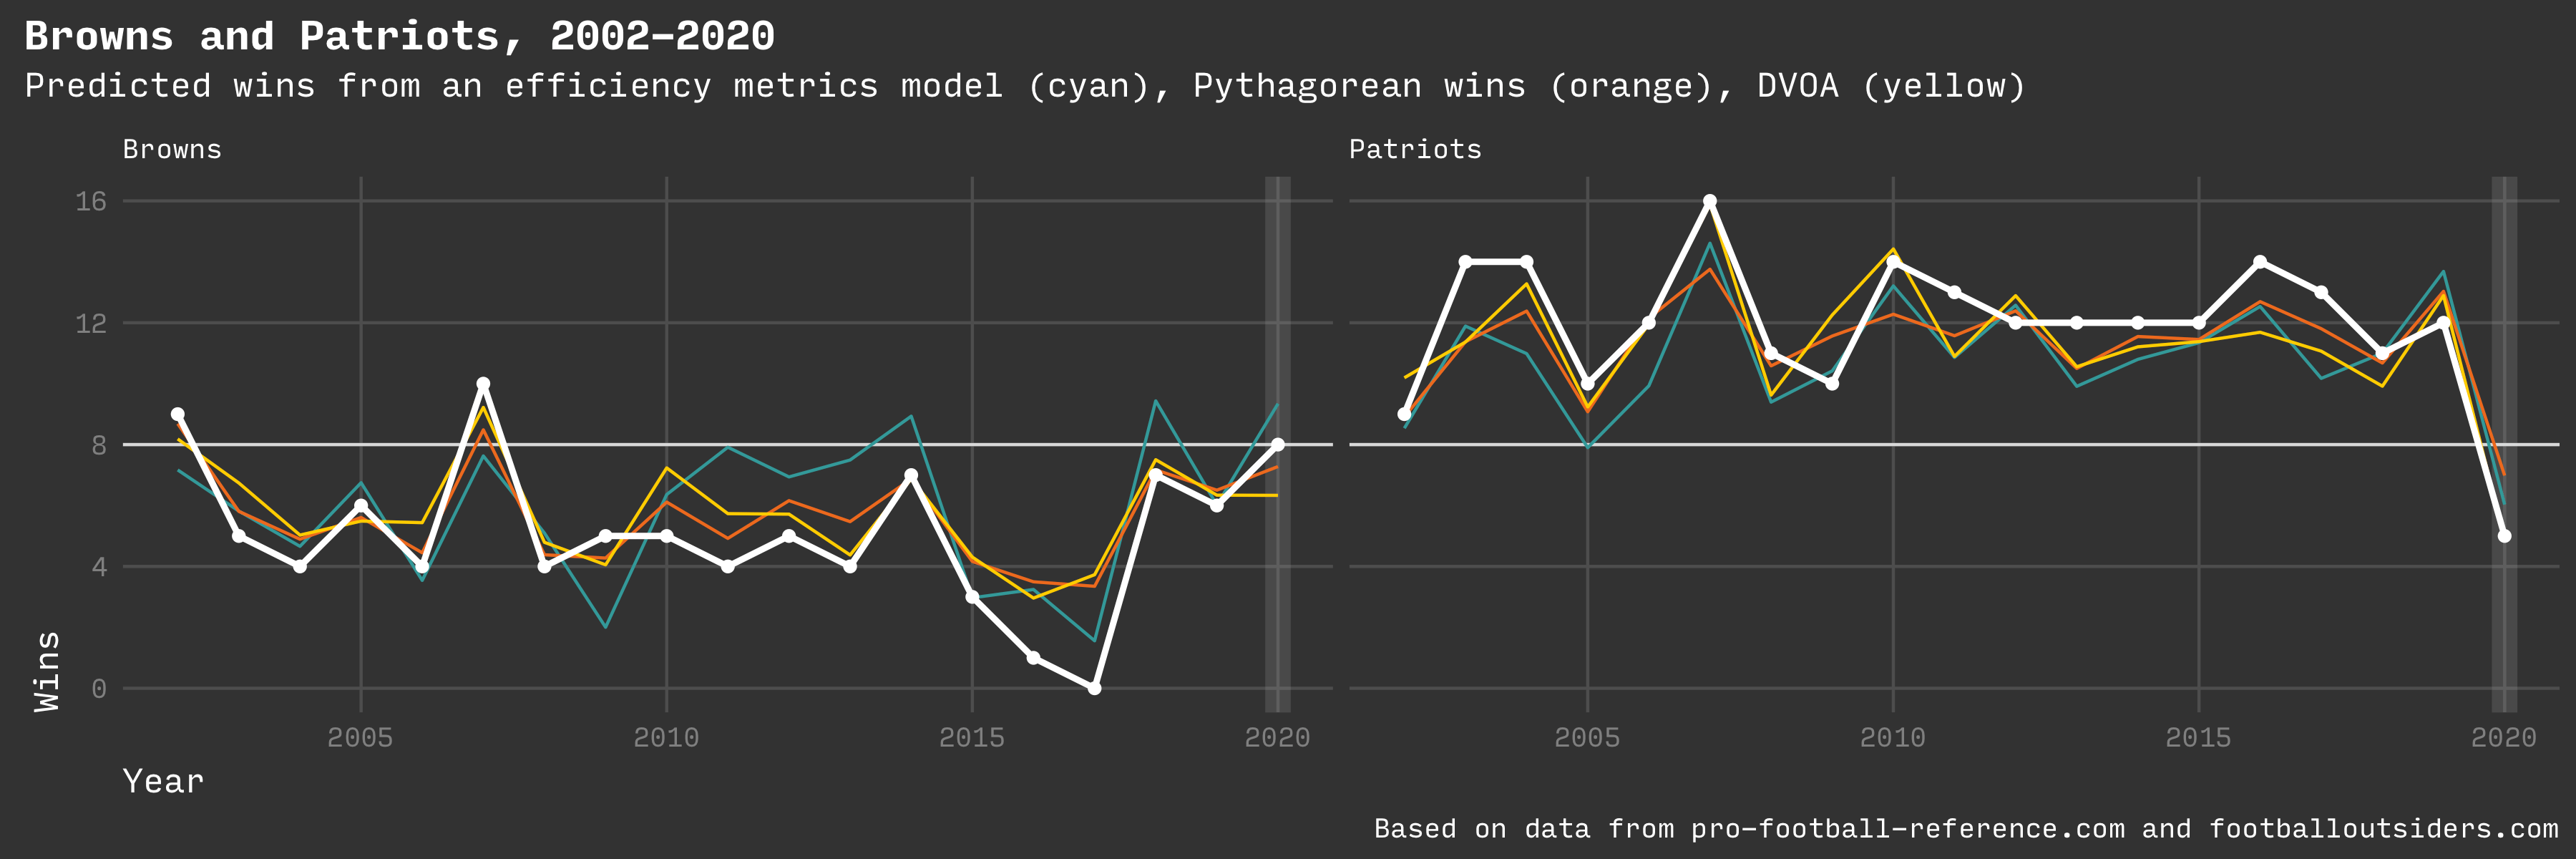
Predicted wins for Browns and Patriots
Predicting anything is difficult, but the model does a good job, with an R² of 0.72 which means that the attributes of the model describe 72% of the variation in the dataset. The DVOA model does even better, but it’s a proprietary metric that is difficult to learn from as far as why a team does well or how any team could start winning more.
For some teams, the model appears to be consistently wrong. Rather than throw out the model, it might show how some teams are better at making game day decisions or are just lucky.
For example, the Cleveland Browns seem to consistently under perform the prediction of all three models in most seasons over the past 20 years. Even if they did perform to the model, they would win fewer than half of their games in most years. In contrast, the New England Patriots are predicted to win most of their games in most years and usually manage to beat that. The AFA site has some theories about possible explanations.
Code
The idea of writing a linear regression model initially seemed intimidating and difficult. It turns out that it involves one or two lines of code, plus whatever code is necessary to load and prepare the data.
Dataquest has a great article on predictive modeling, using some of the demo datasets available to R. I wanted to use real world data, so I saved 20 years of team stats from Pro Football Reference as CSV files.
As described in the article, I collected the various stats and then normalized the team stats in each year by comparing each stat to the league average. The result is a z score that describes how far a team is from the average.
The other question is “What years should be used to train the model?” The original article used 2002-2006 since it was written in 2007. I wanted to start with more recent years as a baseline, so I trained the model on 2015-2019. I also tried a random 50% sample from the entire dataset, but I achieved a higher R² when using full years with all teams.
I used these values to build the model.
build_regression_model <- function(data) {
  lm(
    W ~ ZDefPassYardsPerAttempt +
      ZDefRunYardsPerAttempt +
      ZDefIntRate +
      ZDefFumbleRate +
      ZOffPassYardsPerAttempt +
      ZOffRunYardsPerAttempt +
      ZOffPenYardsPerPlay +
      ZOffIntRate  +
      ZOffFumbleRate,
    data = data
  )
}

nfl_win_model = build_regression_model(data)
I assigned the output of the model to a variable, and then used that to predict a number of wins for each team.
wins = predict(nfl_win_model, team_stats)
How close did I get to the original model? My values correlated to wins in very similar numbers to the original blog post. The biggest divergence was on the offensive penalty rate where I was -0.10 off from the original. Training on the 2015-2019 dataset was even further off on that value.
One reason might be that the original model used both offensive and defensive penalties. Or it might have been more selective on what kinds of penalties were used.
| Stat | AFA Corr | Mine 2002 | Mine 2015 |
|---|---|---|---|
| Off Pass | 0.61 | 0.59 | 0.53 |
| Def Pass | -0.47 | -0.45 | -0.49 |
| Off Fumble | -0.46 | -0.38 | -0.41 |
| Off Int | -0.45 | -0.45 | -0.48 |
| Def FFumble | 0.41 | 0.30 | 0.40 |
| Def Int | 0.39 | 0.39 | 0.42 |
| Off Pen | -0.37 | -0.27 | -0.10 |
| Off Run | 0.18 | 0.19 | 0.13 |
| Def Run | -0.04 | -0.04 | -0.04 |
Graphics
A project isn’t done until it looks fantastic. I had fun creating a dark theme and some colors to display the data (inspired by Justin Palmer’s VibrantInk editor theme).

Over 15 years of predictions for all 32 teams
Conclusion
This was a fun project and gave me confidence in using R after about a year of working with it in my day job.
Since the original article, the author modified the model and then went on to work full time for ESPN. He also wrote a few articles about how it might not be possible to achieve predictive accuracy greater than 76%, due to the role of randomness and luck in NFL games.
The AFA model leans more toward being explanatory (it shows why a team did or didn’t win). The DVOA and Pythagorean models tend to be purely predictive without providing any insight into why a team should win more or fewer games.
Resources
Design Notes: I developed this article theme for a separate article where I took notes on a lecture from a conference. It works well enough for any kind of report that I decided to use it here, too.
The site is generated with Hugo and SCSS.
Other articles
-
A single color retro theme (plus background)
-
What it means to build a career in professional software development education
-
Learn by doing, even before knowing why