Launching new pro sports league is one of the most difficult kinds of businesses to build. Unrivaled Basketball launched their first season of 3-on-3 games in January 2025, concluding a week before March Madness.

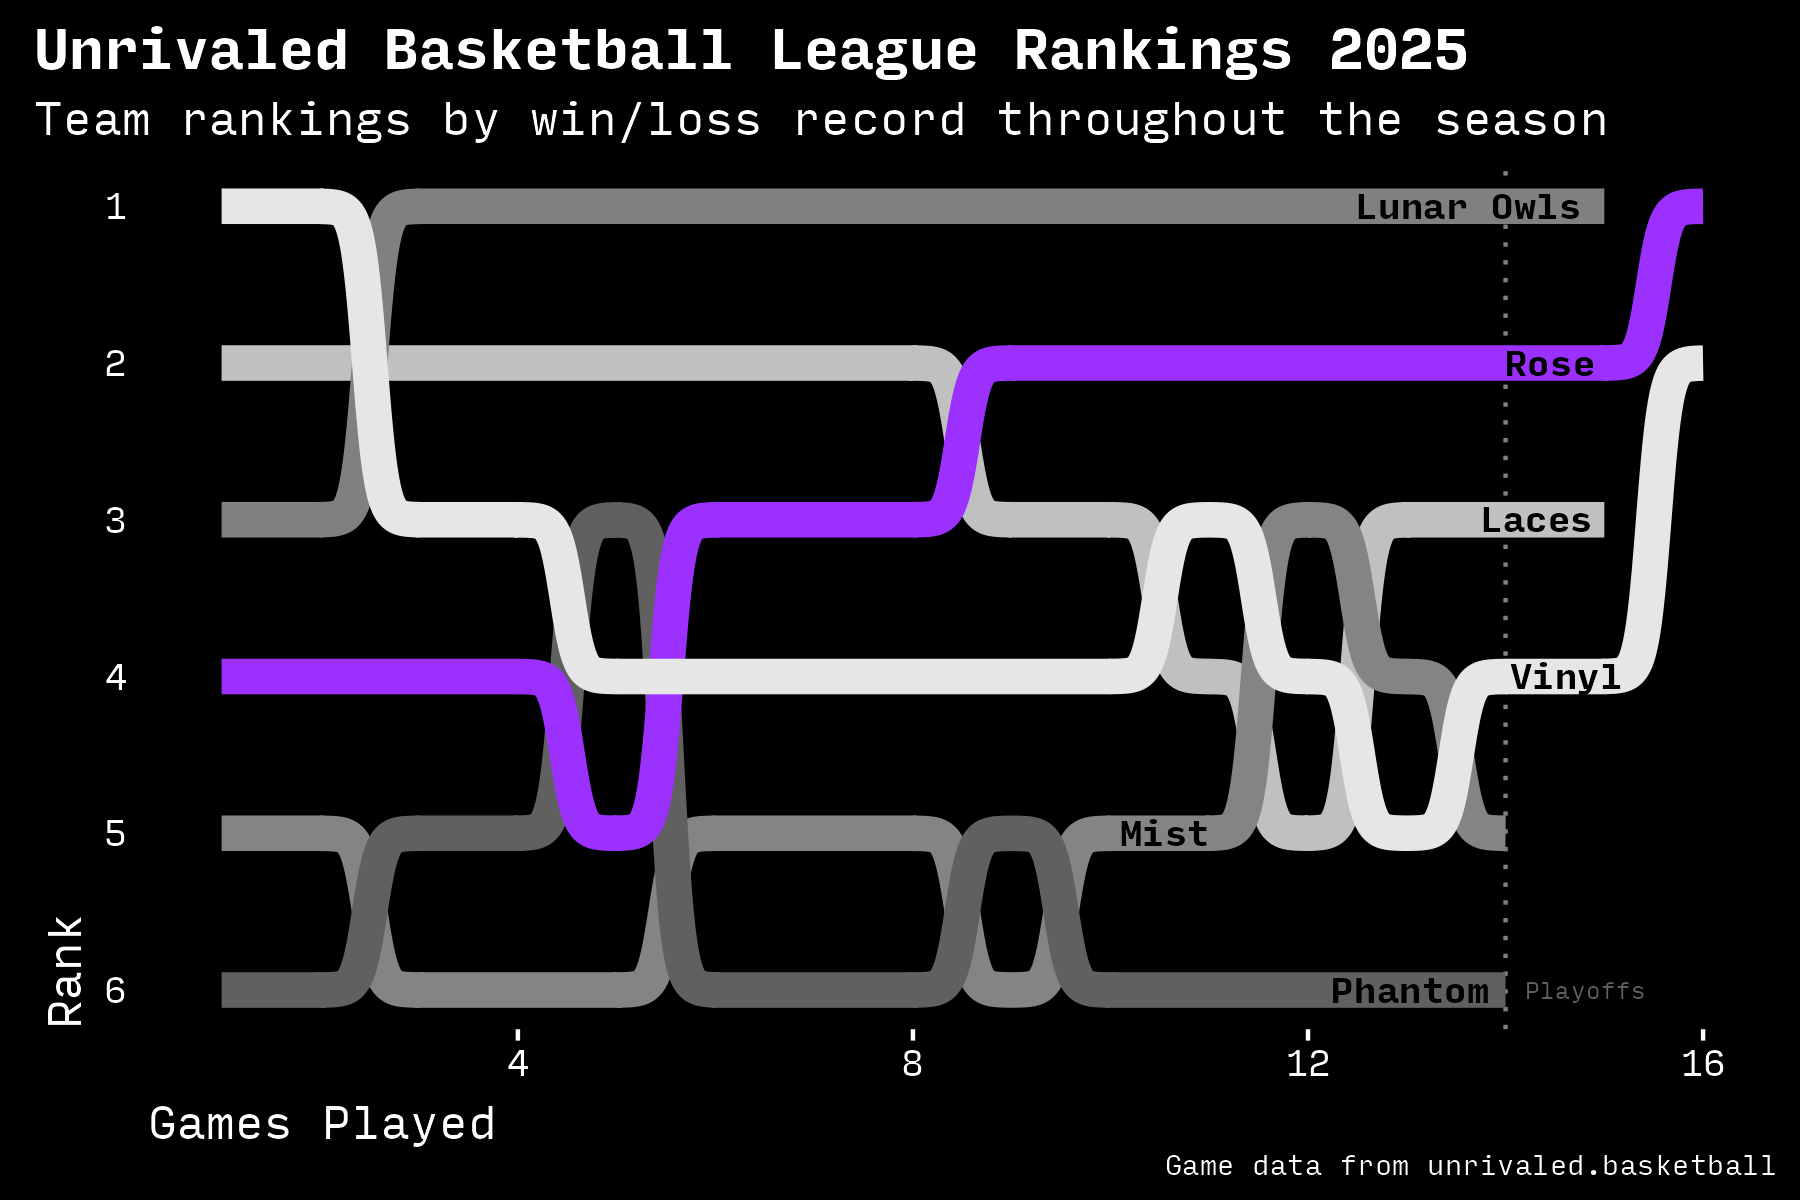
The story through the season by win record, head to head matchups, and point differential
The league debuted with a unique format: three on three basketball with six teams playing 14 regular season games each, followed by a two-round single-elimination playoff. I watched many of the games and really enjoyed both the in-game action and the season-long story lines.
The league created an exciting, fast-paced game with fewer players on a shorter court with a short shot clock. All games were played at a neutral location, creating a level playing field for all teams.
My favorite rule diversions were the move to a single free throw, no matter the foul, and the Elam ending (the winner is the first to reach a score equal to 11 points over the highest score at the end of the third quarter). This means that every game ends on a basket, never just a clock that reaches zero, also accompanied by a flash of the stadium lights, and occasionally, confetti.
Initially, the action was too fast paced. In one of the opening weekend games, the cameras had a hard time keeping up with the frequency of scoring. As the cameras focused on the follow through of a player who had just sunk a three point shot, they missed another bucket which had already happened on the other side of the court. It was all showtime, all the time.
Beyond the rules and gameplay, some interesting story lines developed leading up to the eventual win by Rose in the championship game.
Shooting efficiency
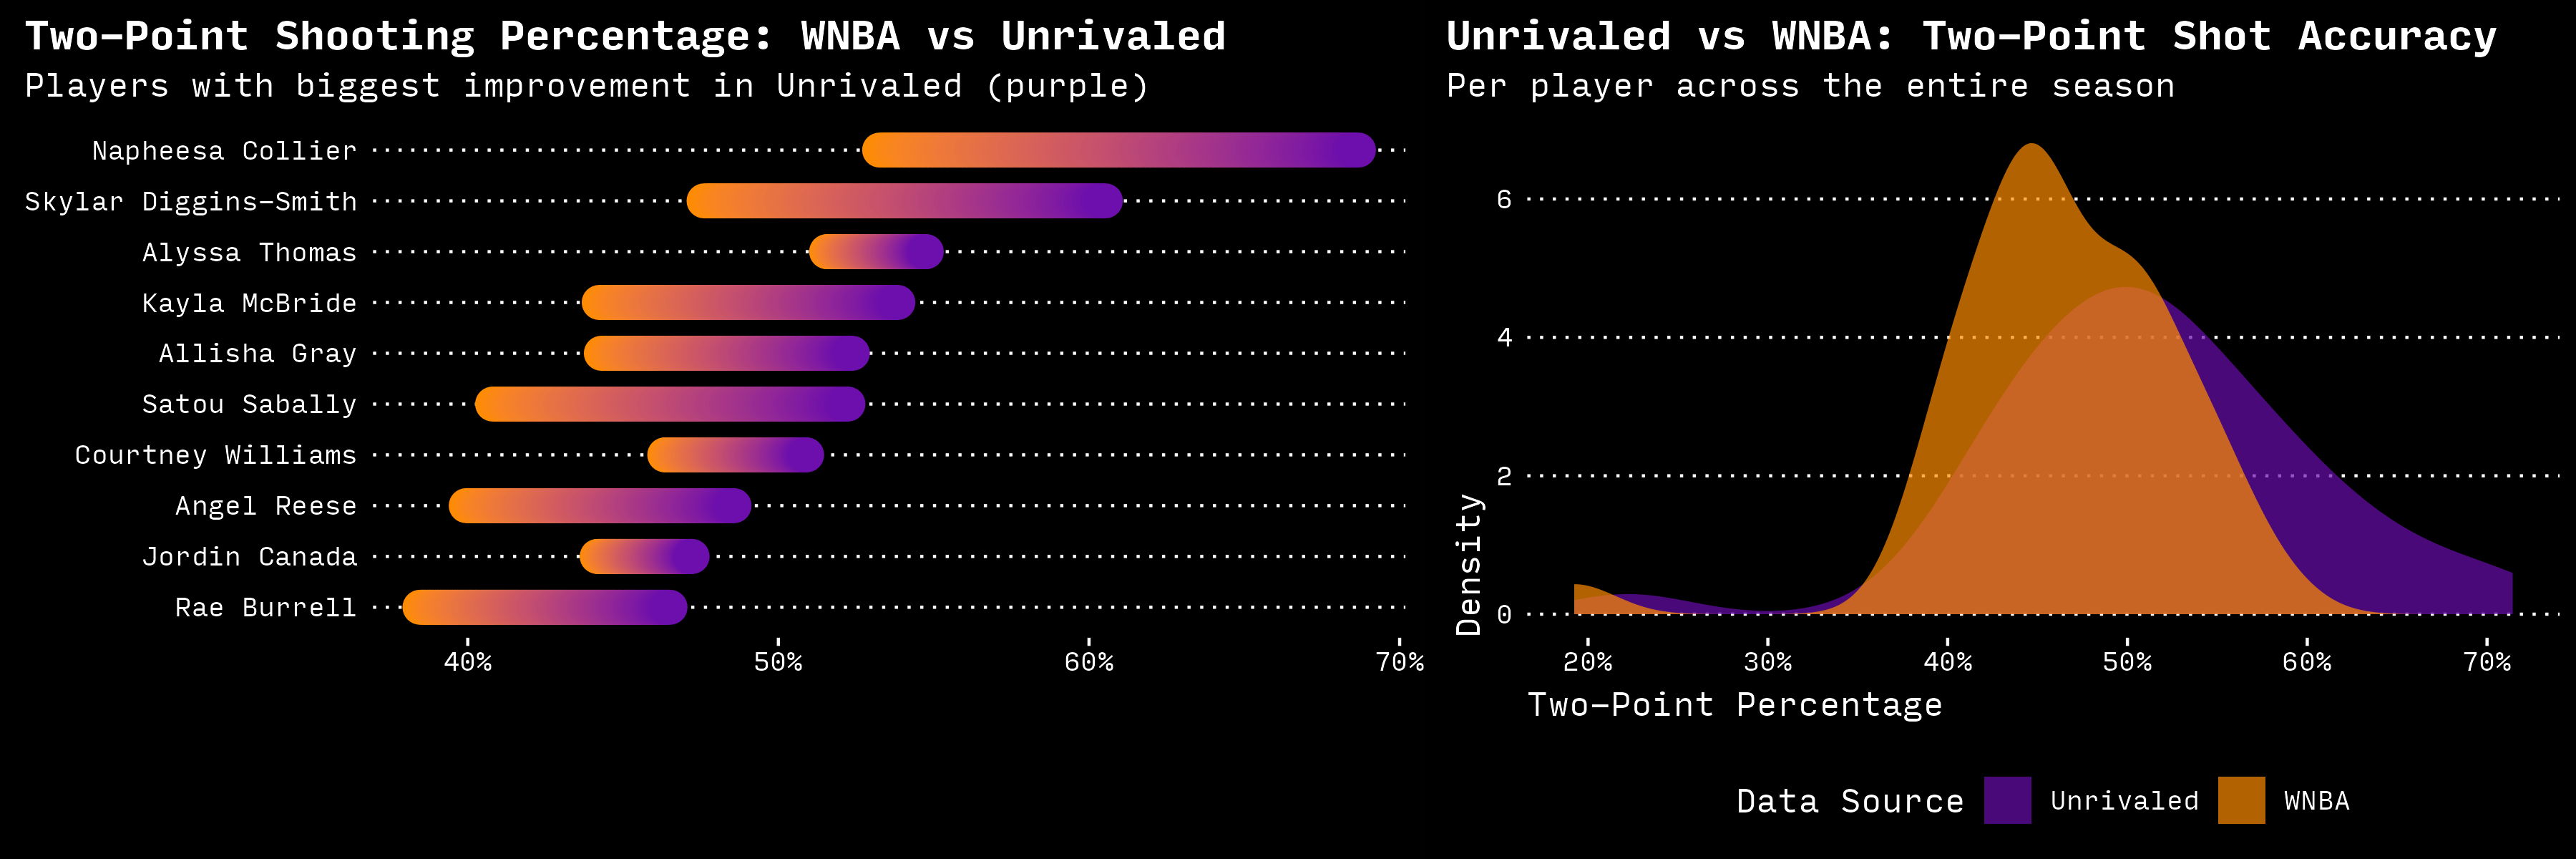
Partway through the season, fans observed that some players were making baskets with much more accuracy than they had in the most recent WNBA season. Was this a league-wide issue or just outsized performance from a few players?

Shooting percentage was similar to the WNBA, but some players improved significantly
I compared the accuracy of the players in Unrivaled with their accuracy during the full WNBA season (these charts only show players who participated in both leagues). Although Unrivaled skews slightly to the right, it’s minor. But a few players did improve significantly. The barbell chart shows that Napheesa Collier (who was already a very accurate shooter) added about 20 percentage points of accuracy. Most others in the top 10 gained five or ten percentage points. Many other players (not shown) maintained their accuracy or slightly declined.
There could be many reasons for this, including fewer defenders on the court, which might have made the 2pt area more wide open. I don’t have real time data to prove that these same players were defended more lightly, but I’ll be looking for that during the 2026 season.
I’m curious if coaches will try to capitalize on this in the future, or if it’s up to each player to find opportunities to create more open shots and to make more of them.
There was even less of a difference when comparing 3pt accuracy (not shown).
Lunar Owls: Dominance and a sudden exit
The Lunar Owls dominated the regular season with a 13-1 record, their only regular season loss coming against eventual champion Rose. But they unexpectedly lost to Vinyl by three points in the single elimination playoffs and their season ended.
Up until then, their statistical dominance was remarkable:
- Regular season point differential:
+170(136points ahead of the next team). - Average margin:
+12points per game. - Highest Elo rating entering the playoffs.
75%win probability in their single playoff game. If they had advanced to the playoffs, they would have started out with a65%WP against Rose.- Rose had a
62%win probability in their actual title matchup against Vinyl but would have had only a35%chance of winning against Lunar Owls, a swing of27percentage points.
How Vinyl made it to the final
The story gets even weirder. The only reason that Vinyl made the playoffs was because of a sequence of tie break rules after the last game of the season. Both Vinyl and Mist had the same record, and they tied 1-1 in the two games they played against each other. Mist had a better point differential throughout the season, but Vinyl had one more win against the other three teams that had made the playoffs. That was the tie breaker, so they made the playoffs, beat the best team in the league, and went to the championship game.
But by other numbers, Vinyl wasn’t the fourth best team in the league. They had a slightly worse Elo than Mist, and one of their wins was during a game that was cancelled after a brief 0-11 score. But it made for exciting entertainment.
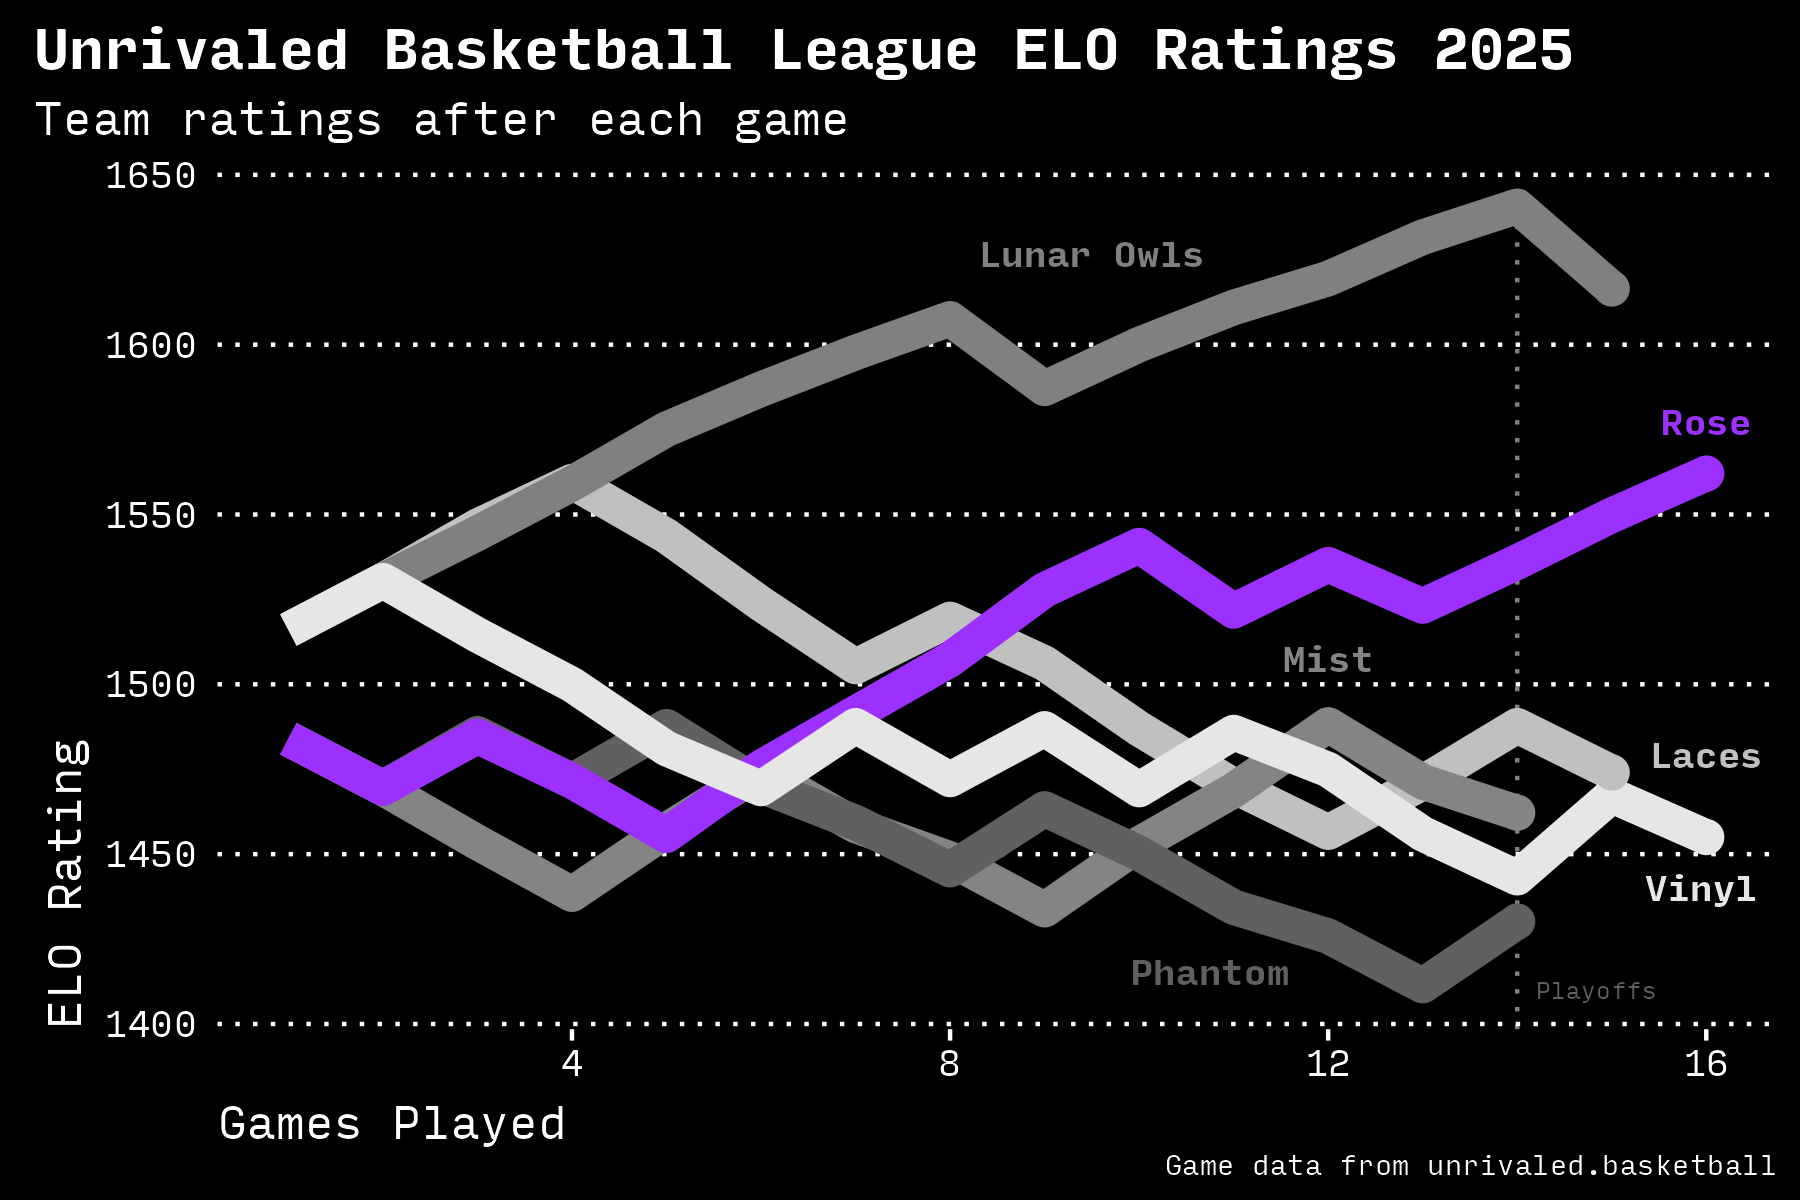
Regular season records and final Elo ratings looked like this.
| Team | Record | Point Differential | Final Elo Rating |
|---|---|---|---|
| Lunar Owls | 13-1 | +170 | 1617 |
| Rose | 8-6 | +34 | 1562 |
| Laces | 7-7 | +20 | 1474 |
| Vinyl | 5-9 | -54 | 1455 |
| Mist | 5-9 | -30 | 1462 |
| Phantom | 4-10 | -140 | 1430 |
The Rise of Rose: Champions
Rose’s championship run was particularly interesting. After a slow start, they improved dramatically after week five, climbing from fifth to second in the rankings. Their Elo rating also shows this progression, with a significant upward trend that continued through the playoffs. This improvement coincided with a decline in Laces’ performance, who started strong but took a turn downward at about the time that Rose started winning.

Statistical Analysis
The Elo rating system originated as a way to compare Chess players based on who they played and whether they won or lost. I used the standard K-factor of 32 and initial rating of 1,500 for each team to calculate team strength throughout the season. The Lunar Owls’ dominance is reflected in their consistently high Elo rating, while Rose’s dramatic improvement is visible in their rating’s steep upward trajectory.
The Lunar Owls maintained the top spot for most of the season, while other teams jockeyed for position below them. The final playoff results demonstrate the inherent unpredictability of single-elimination tournaments.
Technical Challenges
With no official data feed, I had to scrape game data from HTML pages lacking unique identifiers in markup or CSS. The Cursor AI IDE helped streamline the process, but still required significant debugging and aesthetic refinements.
I used the Cursor AI IDE to develop most of the initial code, starting with a specification written in Markdown.
I was impressed that Cursor integrated my own high contrast chart theme after being given a minimal prompt with the URL of my repo at GitHub. I’m not sure if it learned from my code, from my README, or from other developers’ code. At any rate, it worked.
However, Cursor was sometimes too ambitious. It initially generated the code to calculate Elo from scratch, but it was nowhere near to accurate. I prompted it to use an existing R package which worked instantly.
The experience of coding with an LLM is much different from coding by hand. I started with a vague description of what I was looking for, and then refined it with more prompts or took matters into my own hands and wrote the code myself. This worked especially well for visual tweaks to the graphs. Cursor was effective at refactoring, at adding single features (such as the dotted line to mark the end of the regular season), and at generating color codes. But I modified the placement of labels and decided on the final look and feel.
Looking Forward
The league’s inaugural season showed promise and I hope it is successful in ways that the XFL and other leagues weren’t. The short season and playoff format created intense competition and a bit of randomness, while the modified rules made every game entertaining. Hopefully there’s an official data feed next year. In the meantime, the league published play by play data and final box scores that could be scraped and re-interpreted in the same way that NFLFastR recreates basic metrics and augments them with EPA, win probability, and other next level analytics.
Future analysis could include:
- Pythagorean win expectations
- Strength of schedule calculations
- Playoff win probability analysis
- Elo prediction accuracy
Other articles
-
When you code with an AI agent, you're a code reviewer
-
An end-to-end real-world product development class in about 20 minutes
-
Enhance your own learning or give your students tasks that will build proficiency